← Visualizing Knowledge
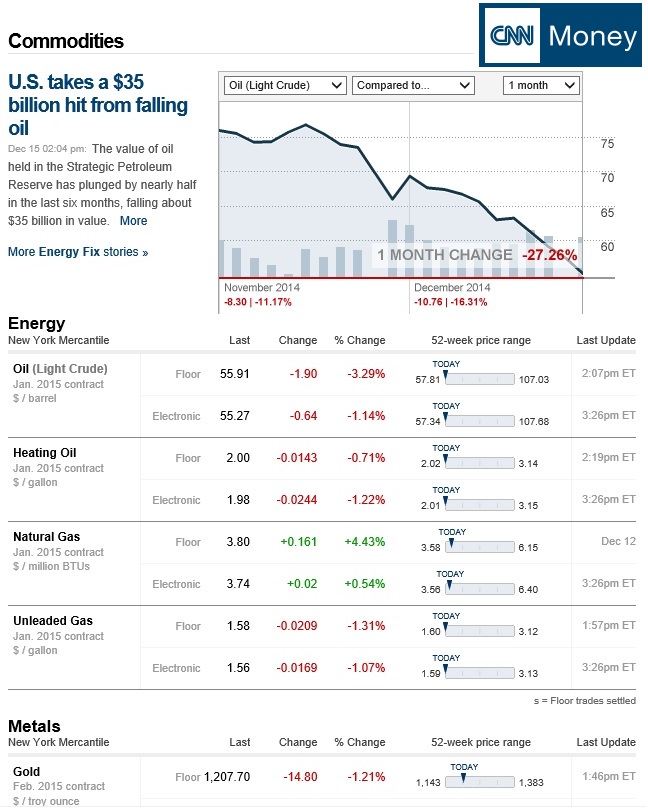
CNN Commodities Graph
Your email address will not be published. Required fields are marked *
Comment *
Name *
Email *
Website
Δ
This site uses Akismet to reduce spam. Learn how your comment data is processed.


