


12 Jul Anatomy of Insight: Prediction and Qualitative BI

Celestial and Earthly Bodies
 Joe Roushar – July 2018

Not just any body
Body is a versatile word as it has broad application. In the context of astronomy, we describe celestial bodies. In topographical mapping, there are bodies of water. But in my interactions, I most often encounter “body” in the context of human physiology. The word, “body” implies both clearly defined limits (i.e. what is not part of the body is excluded), and a sense of completeness, as in “embodiment“. I am borrowing the body as a metaphor for the set of things I think are needed to automate prediction and delivery of qualitative BI or business intelligence. As metaphor is more poetic than scientific, everything I suggest is subject to technical argument and contradiction. But I hope this description will provoke constructive thought and stimulate ideas.
The ability to “predict” is a result of better insight, as are ability to detect and ability to understand. Merriam-Webster tells us that Insight means:
- the power or act of seeing into a situation : penetration
- the act or result of apprehending the inner nature of things or of seeing intuitively
If penetrating insights enable us to better predict and make decisions that lead to better outcomes, then the current direction of the analytics industry toward predictive analytics and prescriptive analytics will benefit all who strive for these improvements.
| detect | understand | predict |
| identify the presence of something – particularly a thing of interest | correctly interpret the meaning of something detected | describe a future phenomenon based on present understanding |
New tools are emerging that will reduce the need for human analysts to pore over data, charts and graphs to find the secrets that will change their fortunes. Intelligent agents to pre-process and correlate multi-source data will deliver qualitative and prescriptive intelligence.  Such tools will improve our human capacity to detect, understand and predict using data from multiple sources. Some predictive analytics and almost all prescriptive analytics require more capabilities than most BI and visualization tools offer today. They deliver descriptive graphics and excellent modeling tools for what-if scenario exploration, but they don’t explain why the data tells what it does about the past or present, nor what to do, nor do they automatically validate predictions based on the data. For these capabilities we need to combine AI and BI strategically. Using current BI systems without AI, actionable information can only come from the brains of the people using the advanced visualizations to draw insights and spot patterns.
This post touches on many concepts I have addressed in earlier posts, so there are more links to this blog than normal. Let’s look at the processes and components of insight as parts of a human body. We’ll focus on qualitative intelligence that enables us to better predict outcomes automatically, I will stretch the metaphor every which way to assemble a holistic picture of the future of analytics. As always, I hope to get feedback on these ideas, so please comment below so I can correct my errors and make better comparisons.
| Understanding Context Cross-Reference |
|---|
| Click on these Links to other posts and glossary/bibliography references |
|
|
|
| Prior Post | Next Post |
| What it Means to Be and Why AI Needs to Know | AI -BI – CI (In draft) |
| Definitions | References |
| qualitative insight predict | Mitrović 1998 Allemang 2011 Bar-Yam 2018 |
| understand actionable information | Pratt 2018 Czarnecki 2015 |
| context concept Universal Theory | Davies 2009 Fensel 2004 Gómez-Pérez 2002 |
 Just finding and associating the right data is a major effort, especially understanding the deep intent or meaning of the data and interpreting its impact. If data discovery and acquisition were greatly simplified, then self-service BI would draw closer to a reality for most users. I will begin the anatomy by suggesting that data discovery and acquisition are like the senses of seeing, hearing, smelling, tasting and feeling. Today, data wranglers, data scientists and data consumers of all stripes are often obligated to find the data and make the correct associations on their own. Automated data discovery and AI-based classification will augment out ability to find the data we need. Natural language understanding Bots will range through existing and new data sources, and see the semantic connections, build out our meaning and intent models, and enable users to know immediately when they have found gems of actionable information. It is as if they will be able to “taste” it. Extending our senses and minds with AI will make finding and associating the right data much easier.
You will know AI and BI are bringing more business value when the tools significantly reduce the burden of human analysis while delivering more actionable insights and correct predictions.
Predicting the Future
 Predicting the weather, next month’s sales or the prices of commodities over the next few months may affect decisions we make today, but good predictions require much data and thoughtful analysis. Diagnosing diseases and proposing treatments, analyzing market trends, designing campaigns, and preventing crime and terrorism require data and analysis as well. So we want better insights to make better decisions – and, if possible, we want the computer to crunch and validate the data for us. Adding big data and unstructured data to the cauldron promises to bring us closer to the ability to accurately predict future outcomes, but this science is still immature. A functional crystal ball would be a great asset, but that is as difficult to find as a goose that lays golden eggs. Without magic, we are left with information and processes. Work to improve the interaction of AI and BI can move the science of prediction forward.
As we delve into qualitative business intelligence, and explore what is needed to enable automated systems to reduce the amount of human brain-work needed to deliver actionable insights, I will try to paint a picture of the information, components and processes needed to increase computer systems’ ability to deliver accurate predictions and prescriptions for action. Some of the information is hard to get and even harder for computers to untangle (Pratt 2018). For today’s metaphor, I propose that the ability to automatically predict and deliver decisions (actionable information) is the brain of insight.
Commercial BI systems are great at answering questions of how much, when, where, and, to some extent, whom. These are largely quantitative and descriptive elements, and descriptive BI is quite mature. Answering “why”, however, is still elusive, and will remain so until we can deliver credible mechanisms for incorporating unstructured information that uses natural language sentences into our BI applications. The kinds of qualitative information that will be most valuable are validated narrative analyses that apply to the outcomes and the causes. This implies, of course, that the AI and BI system must use semantic models of outcomes and causes and the associations between them. Correlations may be useful leading indicators as well, though there is often no semantic connection. There are four places for the application of these capabilities:
- Heuristic processes that analyze the collected data just as a person would, and proposes possible prediction scenarios
- Validation processes that apply constraint-based reasoning to validate or refute each of the predicted scenarios
- Presentation processes that display the predictions along with the associated visualizations for human consumption
- Explanation processes that tie correlations, causes and outcomes to specific data objects for human review
Once you have the data reflecting desired outcomes and possible correlations, you need to apply root cause analysis to determine why each outcome was achieved, then sort outcomes, and identify the most likely causes for outcomes most like the outcomes you want, then prioritize and prescribe them. Automatically identifying causes for the outcomes often means reading authoritative sources on the subject, which requires AI with natural language understanding.
People vs. Machines
When it comes to detecting, understanding and predicting, people are still much better and smarter than machines. So as we continue through the anatomy of insight, and discuss prediction and qualitative BI, one important possibility is gathering peoples’ observations and opinions. Published materials from reliable human observers can lead us to better understanding of causality and possible outcomes. There is significant power in automatically correlating other people’s insights, often in the form of narrative text analyzing the possible causes, reasons and outcomes of observed phenomena (unstructured content), and data showing the timing, location and sequencing of those phenomena (Often structured in databases). People love to share their knowledge, and the amount of published information, albeit unstructured, is massive and massively valuable. For humans to find, sift through and validate opinions without the aid of very intelligent digital agents would be unthinkably hard. With natural language understanding Bots that can do the heavy lifting, leveraging expert human value judgements on which sources are most likely to be reliable, the task of adding observations and opinion on causality and probable outcomes is doable. The combination of massive amounts of statistical data, and small amounts of trusted considered opinion may be a key to better insights.
The illustration below shows how the components I am describing fit together anatomically.

Constraint-Based Prediction
I have posted more than once on inference and constraint-based reasoning heuristics. Forward chaining and backward chaining inference can be performed on production rules and may be suitable for some simple prediction scenarios where the links between facts are well documented in the ontology, glossary and/or formulas. More often, constraint-based models will use natural language processing in conjunction with the ontology, glossary and/or formulas to infer causes, correlations and future outcomes. “CBM is extremely computationally efficient. State constraints, which form the basis of CBM, are very expressive… The time needed to acquire, implement and test a constraint is less than times reported for the acquisition of production rules” (Mitrović 1998).
I will dedicate a post to further explanation of why CBM is a good approach for the prediction and validation heuristics. The approach should use causal chaining to find root causes (see SixSigma 5 Whys) to at least a second or third level of depth, otherwise the predictions could be too facile, shallow or naive. Fishbone or Ishikawa heuristics may also be useful here. Both causality and correlation are useful indicators, and used in tandem, reinforce one anther. The use of these techniques, in combination with machine learning (ML) using Bayesian probabilistic reasoning with natural language understanding, will be the foundation of the next generation of AI-enabled BI systems.
Visualizing Meaningful Phenomena
 The blessing of vision, shared by creatures from the smallest bugs to the largest whales, is essential for survival, and a source of learning, communicating and delight. It may be more intuitive to associate BI visualizations with the eyes or head, but I think of visualizations as needed to support the whole analysis process and to expedite understanding, thus I am describing visualization as the legs and feet of qualitative and prescriptive BI. The worth of a picture is not only in the density of information it contains, but in the proximity to observable reality. Words and numbers are so symbolic that they occupy a space that is further separated from reality than images. Furthermore, our brains are so good at processing images (we do it continually during our waking hours), that we can draw conclusions from pictures extremely rapidly.
Even though homo-sapiens is a symbolic species, visualizations are critical to our understanding. Even the word, “insight” implies the visual sense. And while this blog uses words to share my ideas about how things are and should be, it is often the pictures that are the most memorable. Are the legs and feet any less a part of the body than the head and heart? No. It is true that people without legs and feet can live normal lives. But if those same people were given a choice, I think most would prefer the mobility that they provide. Can you have advanced qualitative and predictive analytics without visualizations? Yes. the words and numbers are sufficient to provide meaningful, advanced insights. The power of combining words, numbers and graphical depictions, however, multiplies the effectiveness, and is nearly indispensable.
Context is Critical
 Both AI and BI tools deliver more value with more context. Wikipedia suggests that context is an essential component of insight: “Insight is the understanding of a specific cause and effect within a specific context
Furthermore, the meaning of words, and their intent, depends on context. The same word in different contexts can mean different things. For example, “profit” seems like a straightforward word, especially when paired with terms like “loss” as in “profit and loss statement”. But in the words “Maybe she can get some profit in the midst of her grief and loss” profit means something similar, but also very different. The word “unbelievable” can be used to mean something amazingly good or bad, or simply something that can’t be trusted. Intended meaning, or intent is not always clear to humans, and sometimes words are intended to convey multiple meanings. But given enough context, humans can, in most cases, apprehend multiple meanings, resolve the ambiguity and penetrate the layers to discern the intent. I don’t know how soon machines will be able to match human competence in discerning intent, but the principles we are exploring can lead us in that direction.
Intent is the oxygen of AI, and at some level, understanding intent is related to advanced AI and BI functions, especially prediction. So shall we say that the meaning model, upon which intent rests, is the lungs. Another way to describe the meaning model is the “Semantic Model” or the “Semantic Abstraction Layer.” I have discussed ontology as a framework for meaning models (Being and AI) (Choosing a Framework) (Six Reasons) (Meaningful Relationships), and will assume some understanding of this approach throughout this post.
Semantic Layer
 The lungs of this patient have three components: The model (ontology), the glossary and the metadata. Think of the metadata as the alveolar sacs that fill with oxygen needed by the blood, the model as the bronchial tubes through which the oxygen transits to get to the sacs, and the glossary the membranes through which the oxygen flows to refresh the blood.
The glossary (controlled vocabulary) is linked to the ontology, metadata and BI data by the words that constitute the measures and indicators that represent the most important elements of meaning in the organization. Typically, the number of concepts in the ontology and metadata dramatically exceed the number of terms in the glossary. But for the advanced heuristics, all the known concepts are critical. Data catalogs may act like glossaries and vice-versa. The minimum requirements are: unique terms, definitions, formulas that include enough lineage information to select the right sources, synonyms, and links to the ontology and metadata. The metadata for each source or information asset should include a reliability score (please check out the “High 5s” post).
Data Discovery tools or Bots are the like the diaphragm that enables the lungs to fill with oxygen and expel carbon dioxide but I have chosen to compare them to the five senses as part of data acquisition. The goals of discovery are to extract all business concepts in the documents, data table and column names, and possibly the database record values as well, and populate metadata for the objects scanned, and add missing concepts to the ontology. The ontology should contain all terms in the glossary, and should provide robust conceptual associations, especially causal, hierarchical and synonymy links. As the glossary is already tied to the ontology, each new data/content asset’s metadata record that contains references to terms in the controlled vocabulary is fully linked and will be processed in the prediction heuristics.
Managing and curating objects in the semantic layer defines the “intent” model. Carefully associating synonyms makes these processes even more robust and avoids false negatives. Reconciling semantic layer concepts and terms with unstructured content interpretations requires natural language disambiguation, which further reduces false positives. The metadata management system used to build and maintain the Ontology, Metadata and Glossary will either require significant manual effort or powerful automated NLP tools.
Processes, Formulas and Rules
In talking of prediction, I identified the brain as the place where all the information is collated to deliver qualitative BI and actionable insights. But the brain needs blood, and that is delivered by the heart. I would like to suggest that the heart of insight is the processes, formulas and rules that deliver the information to the brain as usable material. Regarding the paradigm of a “Data Driven Enterprise”, Ed Burns says that becoming data driven not all about the data. “Once the algorithms produce a valuation, a group of analysts reviews it and tweaks it as needed to make sure it reflects present market realities (Burns 2017). A process based on “a fusion of machine and intuition is necessary for producing accurate valuations, due to limitations in available data” (ibid). This fusion of machine and intuition is an important key to success, but over time, the balance should shift dramatically toward the machine to reduce burdens on the human analysts.
To ensure consistency with enterprise standards and Key Performance Indicators (KPIs), insight-yielding formulas need to be reconciled with the glossary definitions for words and the meaning model. The basis of this reconciliation can be metadata in which specific data objects in databases, and concepts in documents are tied to specific indicators used in BI systems. Glossary items marked as indicators and metadata on specific information assets, therefor, can contribute to predictive intelligence. As many insights come from analyzing information outside the mainstream, thus possibly not associated with predefined KPIs, we do not assume that the Glossary will ever contain all the terms, rules, formulas and filters an organization needs and wants. But to the extent that there is overlap, maintaining consistency with standards brings significant value.
Building a glossary of key terms, formulas and rules is largely manual, and is different for each organization. But the glossary typically encodes institutional knowledge important to the organization, and can be done effectively by a single person with input from the stewards and subject matter experts (SMEs). Data governance is critical, formal or informal, as data stewards and SMEs perform the key role of building the controlled vocabulary and defining the formulas that make consistent indicators for analytics. The value of data governance climbs significantly when the same stewards and SMEs are engaged in the process of Meta-Model governance.
Heart and Love
I love the song “All you really need is heart” from Damn Yankees. But unfortunately, you may need more.  The challenge of associating information assets with the glossary, and generating and maintaining the metadata can be too much for people, thus the need for AI and natural language processing. Again, data discovery tools augmented with AI (or “discovery bots”) can infer the associations needed to generate and maintain metadata, and correctly associate information assets with the glossary and knowledge ontology. With the inferred metadata, human stewards and SMEs can supervise the AI and machine learning with a fraction of the effort of constructing it themselves, and tie all the structured and unstructured information together in a single network of knowledge. This knowledge network provides the oxygen for qualitative and predictive BI.
The heart is a highly technical organ that works hard to deliver the blood to the rest of the body, including the brain, which is ultimately tasked with delivering more actionable insights. Associative data models, rules, filters and formulas are great and essential, but not sufficient for prediction and prescription. The heart of this patient is made more powerful by working in tandem with the lungs, the semantic layer, that infuse the blood with the oxygen of meaning using AI and NLP.
Empirical and Theoretical Probabilities
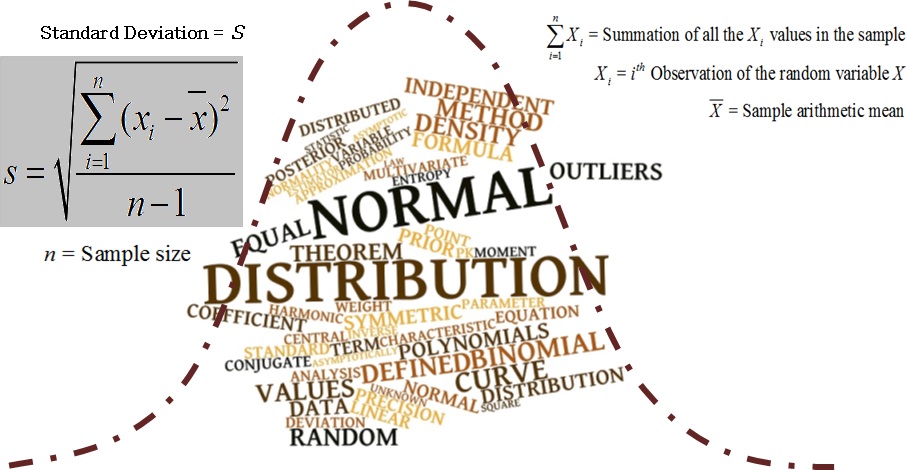
Probabilistic techniques can support both visualization and advanced heuristics. Data derived from observations of an experiment can be used to calculate an empirical (or experimental) probability.

Empirical Probability Formula
- Conduct the experiment many times
- List all the different the outcomes observed
- Count the number of outcomes observed
- Count the number of each outcome
- Use the probability formula to describe the probability of each outcome

Theoretical Probability Formula
Mathematics of Probability
 Calculating probabilities is needed for the heuristics I described above as well as for generating useful visualizations. Each causal element affecting the subject outcome may be treated as a separate constraint. Each correlated element may be treated as a separate leading, trailing or concurrent indicator. These heuristics would consider the historical or present distribution of outcomes and infer the likelihood of future outcomes based on context. It is a fallacy to suggest that the past determines the future. It is often true, however, that, all things being equal, past outcomes are good indicators of future outcomes. The caveat, “all things being equal”, refers to context, and how proximal constraints and environmental changes may impact outcomes. Assembling compelling causes and correlations improves the reliability of predictions, and enables automated prioritization based on leading indicators.
In predicting the cost of insuring motorists and their cars, for example, actuarial risk factors are combined to derive cumulative distribution functions. More context will provide better insights into past and current outcomes and possible causes. Each contextual factor becomes a variable, and the multi-variate cumulative distribution can be calculated to show phenomena as multi-dimensional pictures. We may discover that increases in the number of people who carry smart-phones and changes in the frequency of severe weather events, among many other factors such as age, training, traffic volume, etc, affect the actuarial risk of insuring motorists. Knowing this, insurers are forced to adjust their rates to be able to maintain adequate reserves to be able to pay out all collision claims.
While using graphics to display the results of analyses may be valuable, at a certain level of complexity, the usefulness diminishes. Multi-variate statistical distribution graphs such as the one shown above may be eye candy, so any derived predictions should be spelled out in plain English or the native language of the user.
Complex Probabilistic Reasoning
 Comparing the probabilities of winning at dice or poker to predicting outcomes in a complex world is a bit naive. Why? because 6, 13 and 52 possible outcomes don’t translate well to consumer behavior, weather patterns or human health. “Behaviorism is a classic illustration of the limits of empiricism. Examples include the experiment of Pavlov on the behavior of dogs and Skinner’s similar experiments on people. Under controlled conditions, limiting stimuli and only monitoring a small number of behaviors, empirical results can be recorded. If we gradually expanded the number of options, the number of possible results would grow exponentially, and recording them all would be impossible” (Bar-Yam 2018). Simple ratios, as described in the formulas above, are not likely to reduce the amount of human analysis needed to support better decision making in complex domains.
Some theoretical insights may be developed by inferring known factors that influence a condition, such as weather or health, then using them to infer the probability of an outcome. By borrowing or creating formulas and incorporating as many known causal factors as possible, more reliable insights can be developed, refined, tested and validated. In medicine and technology troubleshooting, this is called diagnosing when applied to existing conditions or issues. But the same reasoning can be used for prescribing and making decisions about what to do, and what not to do. I.e. Since we know that smoking can cause lung cancer, the prescription for the people who don’t want to get lung cancer may include quitting smoking. Theoretically and empirically, this will greatly reduce the person’s chances of getting lung cancer. We have enough data on the human body to make broad generalizations like this. We also do pretty well forecasting weather, and the amount of data we contribute to that effort is massive. Not so for many other complex systems, markets and behaviors.
Bayesian probability is based on inference techniques that combine multiple factors to establish reasonable expectations. These expectations attempt to represent and quantify a state of knowledge or belief, and instead of frequency or propensity of an outcome, probability is inferred from contextual factors. The Bayesian probability of an outcome tells whether or not you would expect an outcome, based upon knowledge of the contributing factors, compared to the likelihood of all other possible outcomes. A technology built around Bayes’ theories has become one of the most popular approaches to machine learning (ML): bayesian networks. These directed acyclic graphs, and the processes applied to them can produce extremely robust reasoning and learning results. For a great introduction to graphical models and Bayesian networks, please go the British Columbia with Kevin Murphy (Murphy 1998). I have discussed this in several posts including “Gnostic Learning Model” and “Bayes and Search Theory“.
Now that we’ve looked at the processes, though only perhaps superficially, it’s time to go over the content that needs to be fed into the processes to deliver insights.
Rows and Columns – The Bones
From the very early days of analytics, the focus has been on the data. I suggest that the structured data gives structure to the whole body – thus it is the skeleton. The growing number of different users of processed data, and the number of ways in which users need to process data has necessitated a shift to more expressiveness in data. In a typical relational database, we might see data like this:
 Last First MI SSN Sex Age
- Adams Amber D 111-22-3333 F 42
- Jones Jane O 444-55-6666 F 38
- Smith Steve M 777-88-9999 M 40
Though symbolically awkward compared to human language sentences, this is recognizable and fairly expressive as is. It could even be used as a basis for interpreting something in the real world. There are exactly two dimensions to this expressiveness:
1) Rows – Going right, all the data is associated with the head, often a unique name or ID.
2) Columns – Going down, all the data is associated with the column label.
In object-oriented systems, data objects have properties just as people have vital statistics and data tables have fields. It is these properties that make object data smarter by reducing ambiguity and permitting the data to be passed into different programs to yield different kinds of results. Big data models and unstructured data are better tailored for object-oriented data. But there are still many important places for relational data models, and the most robust solutions use both relational and big data together. We can describe relational rows and columns in an associationist framework. In this framework, the data is associated as objects and attributes in which each object is named by data that uniquely identifies a row and each value is the contents of the columns of that row. The attributes, then, are the names of the columns. Associative information modeling treats relational and other data conceptually, and is an important strength in BI and analytics systems that opens the door for seamless AI integration and user-enablement for self-service capabilities.
Joints, muscles and connective tissue are necessary to hold the bones together and provide structure and form to the body. We’ll cover that in the “Wrangling” section. Adding unstructured information, almost completely absent in today’s BI/analytics landscape, is an important step in delivering more predictive and prescriptive insights.
Unstructured Data – The Blood
 “Searching for and analyzing unstructured data required prohibitively high amounts of time, said David Birtwell, director of informatics of Biobank at University of Pennsylvania Health System (Penn Medicine). But its absence from research programs meant researchers couldn’t get as complete a picture of patients, medical conditions and treatment protocols as possible” (Pratt 2018). Over and again in Understanding Context, I have argued for the importance of including unstructured data to support prescriptions and decisions. I discussed metadata management for unstructured content in “Curating Digital Meaning“. “Sustainable Software” describes my ideas about binding structured and unstructured data together with associated process models. One of the core premises of “Understanding Context” is that the ability to automatically resolve the ambiguity of words, whether in data table or column names, database content or the content of unstructured content such as documents and web pages, enables the computer system to develop reading comprehension: the ultimate in machine learning because it so closely resembles a key avenue of human learning. As I said above, the blood goes through the lungs and gets oxygenated, and goes through the heart and enlivens every other part of the body – in this case, the body of qualitative and predictive analytics to support better decisions.
Unsurprisingly, just like databases need regular cleansing, deduplication and mastering, so does unstructured data. How many duplicate and dated documents are exist? I think of the liver and kidneys as the organs we can rely on to master both structured and unstructured data: a necessary step in ensuring our insights and predictions are based on the most reliable content we can wrangle.
Blurring the Boundaries with Big Data
While Structured Query Language (SQL) is the standard way of viewing and manipulating relational databases, NoSQL (Not only SQL) can be used to access structured and unstructured content. Big data is amazing in that the same database can contain structured, semi-structured and unstructured data and still deliver high performance is information query, search and retrieval as well as CRUD (Create, Read, Update, Delete) operations. “Unstructured data…refers to data that doesn’t fit neatly into the traditional row and column structure of relational databases. Examples of unstructured data include: emails, videos, audio files, web pages, and social media messages. In today’s world of Big Data, most of the data that is created is unstructured with some estimates of it being more than 95% of all data generated. As a result, enterprises are looking to this new generation of databases, known as NoSQL, to address unstructured data” (Mongo). NoSQL is an innovative schema-free and join-free mechanism for handling omni-structured content in big data stores with linear scalability on multiple processors (McCreary 2014). Data lakes are proliferating, and NoSQL is a preferred strategy. That means Big Data modes can be both the bones and the blood of our metaphorical insight machine. I will not delve further into this topic today, but Big Data is beginning to have an influence in BI and analytics, and will have a profound influence on qualitative and prescriptive intelligence because of its inherent ability to efficiently process all the priceless fragments of “intent”.
Wrangling and Prep – The Muscles
While you cannot automatically or manually deliver insights without data, the data alone is not enough. Every organization’s data arguably needs a lot of processing or preparation before it is ready to deliver valid predictions or prescriptions. That processing includes:
 Ingestion (five senses)
- The core components of data mastering (liver and kidneys)
- Deduplication
- Cleansing
- Enrichment
- Semantic Association (lungs and heart)
- Meta-Model Classification and validation
- Intent Classification and validation
- Wrangling
- Identifying and acquiring supplementary and related information
- Defining the connection points between information objects
- Selecting or building optimal rules, filters, formulas and visualizations

The process of “data wrangling” has been part of information science for years but the term is new, and the specialization that is entering many large organizations is even newer. Wei Zheng, in an article hosted on TDWI, The Data Warehousing Institute (or is it “Transforming Data With Intelligence”?) says that “Over the past few years, data wrangling (also known as data preparation) has emerged as a fast-growing space within the analytics industry. Once an analysis bottleneck due to painful, time-consuming work preparing diverse data sources for reporting and analysis, data wrangling technologies have come a long way.” The division of labor between the BI consumer, the architect, the wrangler, the data scientist, the developer and the testers have evolved and changed along with the tool sets they need to perform their work. Let’s assume for the sake of this anatomy, that the wrangler’s work precedes the pre-processing steps of heuristic analysis. Let’s also assume that the better our AI tools get, especially Natural-Language-Enabled pre-processing, the less work the wrangler has to do. This is an explicit goal of the work I am doing.
Validating Insights
“Aha moments” may have a downside when the amazing insight produced turns out to be slightly off or wildly deceptive. Thus, it is important to cross-check and validate the things we or our systems discover. The same formulas we used to predict future events, theoretical and empirical evidence can be used to improve confidence in our insights, and we can create formulas to check predictions. As described above, Theoretical probability can be calculated by dividing the number of ways the particular event can occur by the total number of possible outcomes; and the empirical probability of an event is given by number of times the event occurs divided by the total number of incidents observed.
 One of the problems we encounter in validating insights is that narrow focus on a few causes or correlations may obscure the contributions of external factors that may significantly change the outcome. Unless we know what those external factors are, we may think we have uncovered a treasure when, we later discover, it was only “fools-gold”. If you don’t know significant contributing factors from the beginning, your model will be limited in its usefulness, or the output may be wrong so often as to destroy trust. This is one of the reasons I strongly advocate for SMEs helping to build and curate the model. Causal associations will dramatically improve the usefulness of the knowledge ontology.
Consider weather forecasting: In the 1950s, numerical models based on barotropic models and thermotropic models were built and tested. Then, atmospheric dynamic and thermodynamic factors were added to the models to make them more accurate. Over the decades since then, models have evolved to include many additional variables, such as the effect of local surface conditions that improve or inhibit its ability to absorb and radiate sunlight. As the modelers have added theoretical macro and micro factors that influence the predictions, weather forecasts have become dramatically more accurate and reliable.
Such is the case with anything for which we want to seek actionable insights. Understanding the best ways to combine objective statistical data and empirical observations is critical to validating insights. “The complexity of our world, biological and social, is straining the limits of empirical science. Basing scientific progress on a strictly empirical approach, even with massively big data, is not enough. A reframing of science in favor of using data effectively is necessary to face these challenges” (Bar-Yam 2018).
To achieve maximum expressiveness, in addition to reliable processes and people, qualitative insights require natural language explanations. The sources of these explanations are mostly documents, Web Pages, video and audio files, and explanation utilities in cognitive computing systems.
The segregation of structured and unstructured information, and the inability of most systems to bring them together has created an information apartheid. This is one reason that a “whole body” solution offers more. “And if the ear shall say, Because I am not the eye, I am not of the body; is it therefore not of the body? If the whole body were an eye, where were the hearing? If the whole were hearing, where were smelling?” (1 Cor 12:16-17 KJV)
State of the Art
Early BI tools were little more than charting apps for relational data. As discipline grew around Online Analytical Processing (OLAP), denormalized and multi-dimensional models became important to maintain expressiveness while improving performance (too many joins are costly and slow). Major BI tool vendors, such as Cognos and Tableau still operate in the traditional OLAP model, favoring data warehouses. SAP Hana uses an in-memory database to improve performance, but the quasi-semantic layer provided by Business Objects Universes does little to escape the gravity of legacy technology.
Qlik has paved the way for more advanced capabilities by creating an associative data layer that permits advanced and high performance visualizations without building costly data warehouses and data marts. The door is open for more advanced technology insertion to support qualitative and predictive capabilities. Domo has an effective approach of handing specific needs to teams of data scientists for a rapid and reliable solution, but this puts more reliance on human effort. The ideas in his post could lead in the opposite direction, reducing the need for human analysis and pushing the capabilities to a broader audience of potential BI app developers and consumers, paving the way, eventually, for citizen developers to be able to build their own advanced BI apps.
 Adding layers of complexity to the processes of wrangling and preparing data and validating results may seem counterintuitive. Without the contribution of AI and NLP, these advances would be impractical for most organizations. But delegating more of the complexity to the machine broadens the audience of users that can get value from the system, and increases the benefits for all. It’s not magic, it’s hidden. And simply making the tools easier to use, as has been the Microsoft’s self-service focus with SQLServer, will get more descriptive analytics to more people, but will not deliver qualitative or prescriptive insights without adding the layers I have described.
The gravitational forces that have kept most using fifteen- to twenty-year-old technologies require a significant velocity to overcome. AI and NLP are the booster rockets to propel us past quantitative, descriptive intelligence, to qualitative predictive and prescriptive intelligence, and the insights that will dominate existing markets and initiate new ones.
Click below to look in each Understanding Context section
| 1 | Context | 2 | Brains | 3 | Neurons | 4 | Neural Networks |
| 5 | Perception and Cognition | 6 | Fuzzy Logic | 7 | Language and Dialog | 8 | Cybernetic Models |
| 9 | Apps and Processes | 10 | The End of Code | 11 | Glossary | 12 | Bibliography |
Many of the images are from the stock photo library of 123 Royalty Free – https://www.123rf.com/
SHARE THIS ARTICLE


[…] smart analytics (see “Anatomy of Insight: Prediction and Qualitative BI“). […]